


What WAR Measures

- Considers all aspects of a players game and summarizes their total contributions in a single stat
- Through a series of equations, overall effort is translated into wins (pitchers and pos. players use different methods / equations to arrive at a WAR number).
- Specific calcluations for both ‘position players’ and ‘pitchers’ are found below.
- Through a series of equations, overall effort is translated into wins (pitchers and pos. players use different methods / equations to arrive at a WAR number).
- WAR Allows us to figure out how much better someone is than a replacement level player (i.e. a guy you could acquire any time for the league minimum)
- The League Minimum is $555,000 in 2019, up from $545,000 in 2018.
Generally Speaking:
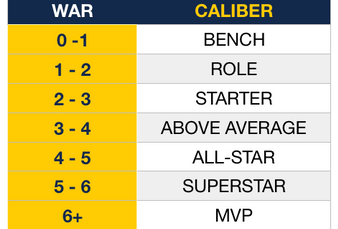
- An accurate estimate of a players value to that point in the season
- Top Brewer Career WARs:
- R. Yount (77.3)
- P.Molitor (60.0)
- R. Braun (46.4)
- C. Cooper (30.7)
- D. Money (28.4)
- Best Brewer Season WARs:
- R. Yount – 10.5 (1982)
- C. Gomez – 7.8 (2013)
- R. Braun – 7.7 (2011)
- C. Yelich – 7.6 (2018)
- T. Harper (1970)
WAR Is Relative…

-
Two Adjustments are applied to WAR:
- Positional: The TABLE shows us the adjustment applied
- NOTE: If all positions produce at the same level, the catcher will have the highest WAR
- League: a small correction that allows each league’s runs above average balance to zero
- Positional: The TABLE shows us the adjustment applied
- TAKEAWAY: WAR is relative to effort, league and position for that year (a true ‘comparison stat’)
Collective WAR = Actual Wins

- Adding all the WARs on a roster roughly adds up to equal the team’s actual win total.
- A team made entirely of replacement level players will win 48 games per year (0.294 Winning Percentage)
- A negative WAR means that when you consider everything a player does, he is worse than the league average

EVEN THOUGH HE SELF-ADMITTEDLY WON’T BE ON THERE… CLICK UECKER FOR BREWERS ALL-TIME STAT LEADERS
THE CALCULATION

WAR (Pitchers)

BREW MATHsummary
Pitcher WAR is calculated differently depending on who you ask:
- Baseball-Reference
- WAR = WAR_rep + WAA + WAA_adj
- Driven by Runs Allowed and Innings Pitched
- FanGraphs
- WAR = [(League “FIP” – “FIP”) / Pitcher Specific Runs Per Win] + Replacement Level) * (IP/9)] * Leverage Multiplier for Relievers] + League Correction
- Driven by FIP = (13*HR)+(3*(BB+HBP-IBB))-(2*K))/IP + lg_specific_constant
- FIP Constant is usually around 3.20 and changes every year
- WAR = [(League “FIP” – “FIP”) / Pitcher Specific Runs Per Win] + Replacement Level) * (IP/9)] * Leverage Multiplier for Relievers] + League Correction
WAR Comparison
Getting into every detail of these calculations is beyond our scope here. That said, there is endless information on the subject for the curious mind…
If you want to get really nerdy with WAR, click Braun before he hits the ball:
